




Stats Recovered black outline icon

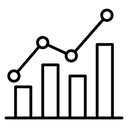
Outline bar chart with a rising line graph and round data points above
Related tags
About the Stats Recovered black outline icon
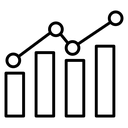
Four vertical bars of varying height stand along a baseline while a connected line graph runs above them, its round data points dipping once before climbing to a high peak on the right. It reads as figures returning to growth and fits analytics dashboards, financial reports, recovery statistics slides, business presentations and admin panels tracking performance.
The bars are evenly spaced open rectangles, the second one noticeably shorter than the first, and the polyline sits clear of their tops so both layers stay readable. Pair it with pie chart and report icons; below 24 pixels the small data circles start to fill in.
This is the black outline version of the stats recovered icon: even, monoline strokes that stay crisp at small sizes and suit clean, minimal interfaces, wireframes and light backgrounds.
Download it free as a scalable SVG vector or transparent-background PNG in seven sizes (16 to 512px), copy the SVG code straight into your project, or open it in the free online editor to change colors, apply gold, silver, neon and gradient styles, animate it, or convert it to EPS, PDF and DXF.
Free for personal and commercial use with attribution.
Icons with the same concept
 Stats Bar Line Chart
 Stats
 Stats Bar Line Chart
 Stats Bar Line Chart
 Stats Bar Chart Arrow
 Stats Bar Line Chart
 Stats Line Bar Chart
 Statistics Bar Line Chart
 Statistics Bar Line Chart
 Statistics
 Stats Bar Chart
 Stats Bar Line Chart
 Stats Bar Chart
 Stats Line Graph
 Stats Bar Line Chart
 Trend Arrow
 Statistics Bar Line Chart
 Statistics Bar Line Chart