



Stats Bar Chart Arrow black outline icon


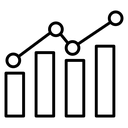
Bar chart of four uneven columns with a zigzag trend line and arrow rising to the top right
About the Stats Bar Chart Arrow black outline icon
Four open rectangular columns of uneven height stand on a shared baseline while a zigzag line dips and climbs above them, ending in an arrowhead at the top right. Together they communicate statistics, measured performance, growth and upward progress. Drop it into an analytics dashboard, a KPI card, a finance or sales report, a pitch deck results slide, or an admin sidebar menu.
The bars vary in height rather than rising evenly, and the trend line crosses above them instead of tracing their tops, which keeps both elements readable. Pair it with pie chart, line graph and calendar icons drawn at the same stroke weight. Below 24px, the arrowhead is the first detail to blur, so reserve it for card and menu sizes.
This is the black outline version of the stats bar chart arrow icon: even, monoline strokes that stay crisp at small sizes and suit clean, minimal interfaces, wireframes and light backgrounds.
Get it free as an SVG vector or transparent PNG (16-512px), copy the SVG code, or restyle it in the free online editor — recolor any part, add gold, neon or gradient effects, animate it, or export EPS, PDF and DXF.
Free for personal and commercial use with attribution.
Icons with the same concept
 Stats Bar Line Chart
 Stats Bar Chart
 Stats Bar Line Chart
 Stats
 Stats Bar Line Chart
 Stats Bar Line Chart
 Stats Bar Line Chart
 Stats Bar Chart
 Stats Line Bar Chart
 Stats Bar Line Chart
 Statistics Bar Line Chart
 Stats Recovered
 Statistics Bar Line Chart
 Statistics
 Trend Arrow
 Statistics Bar Line Chart
 Graph Bar Line Chart
 Trend Arrow Bar Chart