Sine Wave Graph color outline icon


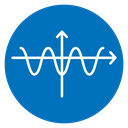
Sine wave curve crossing horizontal and vertical arrowed axes inside a circle
About the Sine Wave Graph color outline icon
Inside a thin circle, a horizontal axis with an arrowhead on the right meets a vertical axis pointing up, and a smooth sine curve rolls through three full peaks and troughs across them. It stands for oscillation, frequency and periodic motion. Use it in physics and math lessons, audio editing tools, signal processing dashboards, electronics documentation, and science presentation slides.
Peaks and troughs are equal in height, so amplitude reads as constant, and the curve is clipped neatly by the enclosing ring. It pairs with waveform, pulse and frequency icons in the same family. Use 32 px or larger so the individual cycles do not blur together.
This is the colour outline version of the sine wave graph icon: the same line drawing in an accent colour, useful for highlighting a state, a category or a brand tone without adding visual weight.
Download it free as a scalable SVG vector or transparent-background PNG in seven sizes (16 to 512px), copy the SVG code straight into your project, or open it in the free online editor to change colors, apply gold, silver, neon and gradient styles, animate it, or convert it to EPS, PDF and DXF.
Free for personal and commercial use with attribution.