
Line Chart color filled icon

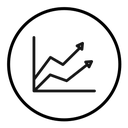

Chart axes with two rising zigzag lines ending in arrows, inside a circle
Related tags
About the Line Chart color filled icon
An L-shaped axis pair holds two jagged trend lines that dip and climb before ending in arrowheads pointing up and right, the whole plot enclosed in a thin circle. Two series instead of one signals comparison as well as growth, which fits analytics dashboards, sales and revenue reports, investor decks, marketing performance pages and admin panels.
The upper line runs slightly ahead of the lower one, so the gap between them reads as a lead without needing color, and the arrowheads keep direction obvious. Pair it with bar chart and pie chart icons; if you tint it, color the two lines differently to separate the series.
This is the colour filled version of the line chart icon: a flat, solid-colour shape that stands out in dashboards, marketing pages and app tiles where the icon needs to carry colour meaning.
Get it free as an SVG vector or transparent PNG (16-512px), copy the SVG code, or restyle it in the free online editor — recolor any part, add gold, neon or gradient effects, animate it, or export EPS, PDF and DXF.
Free for personal and commercial use with attribution.
Icons with the same concept
 Analysis Magnifier Line Chart
 Analytics Report Magnifier Check
 Chart Histogram Trend Line
 Stats Bar Line Chart
 Five Bar Chart
 Circular Bar Line Chart
 Bar Chart Circle Badge
 Analysis
 Pie Chart
 Analysis Report Magnifier
 Line chart
 Line Chart (2)
 Line chart
 Line chart
 Trend Arrow
 Stats
Stats Bar Chart Growth Arrow
 Statistic Up Bar Chart Arrow