




Candle Stick Chart black outline icon


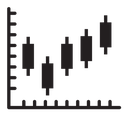
Candlestick chart with five candles and wicks rising along ticked axes
Related tags
About the Candle Stick Chart black outline icon
Five candlestick bodies with upper and lower wicks step across a two-axis grid, with small tick marks running along both the vertical scale and the baseline. The shape reads instantly as price movement and technical analysis, so it fits trading platforms, stock market dashboards, investment landing pages, finance presentations and crypto or forex market reports.
One candle dips below the opening level before the sequence climbs again, giving the chart a believable rhythm instead of a flat staircase. It pairs well with line graph, bar chart and pie chart icons across a finance set. At small sizes place it alone, so the thin wicks stay visible.
This is the black outline version of the candle stick chart icon: even, monoline strokes that stay crisp at small sizes and suit clean, minimal interfaces, wireframes and light backgrounds.
Download it free as a scalable SVG vector or transparent-background PNG in seven sizes (16 to 512px), copy the SVG code straight into your project, or open it in the free online editor to change colors, apply gold, silver, neon and gradient styles, animate it, or convert it to EPS, PDF and DXF.
Free for personal and commercial use with attribution.
Icons with the same concept
 Chart Candlestick
 Chart Candlestick
 Chart Candlestick
 Chart Candlestick Circle
 Chart Candlestick Circle Badge
 Chart Candlestick
 Investment Growth Bar Chart
 Stock Buy Dollar Chart
 Trend Arrow
 Line Chart Rising Zigzag
 Euro Chart
 Investment
 Investment growth
 Investment growth
 Investment growth
 Market Prediction
 Investment growth
 Growth Chart Rising Bars