




Analytic black filled icon


Rising line chart ending in an arrow above two bars on a baseline, inside a circle
About the Analytic black filled icon
A zigzag trend line climbs from the lower left and ends in an arrow head pointing up and to the right, passing over two short columns that stand on a horizontal baseline, all inside a circular frame. It reads as measured performance, positive results and data that is being tracked. Use it in analytics dashboards, admin sidebars, sales and marketing reports, finance apps and investor slide decks.
The line and the bars share the same stroke weight, and the arrow breaks above the circle's midline so the upward motion is obvious even at button size. It sits naturally next to pie chart, dashboard and report icons in the same round-framed family. For tab bars, 24 px is the smallest size where both bars stay distinct.
This is the solid black filled version of the analytic icon: a bold silhouette that reads clearly at 16-24 px and on dark or busy backgrounds, and prints well in one colour.
Get it free as an SVG vector or transparent PNG (16-512px), copy the SVG code, or restyle it in the free online editor — recolor any part, add gold, neon or gradient effects, animate it, or export EPS, PDF and DXF.
Free for personal and commercial use with attribution.
Icons with the same concept
 Analytic Bar Line Chart
 Analytic Bar Line Chart
 Analytic Bar Line Chart
 Analytic Bar Line Chart
 Analytic Bar Chart Line
 Analytic Bar Line Graph
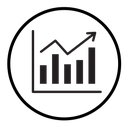 Chart (2)
 Chart
 Line Chart Rising Zigzag
 Stats Bar Line Chart
 Statistics Bar Line Chart
 Bar Chart Five Bars
 Chart Bars Trend Line
 Analytics Bar Line Chart
 Analytics Report Chart Document
 Trend Arrow
 Chart Growth Arrow Bars
 Chart Histogram Trend Line